In today’s always-on digital world, network performance directly impacts business productivity, security, and user experience. From detecting outages to identifying bandwidth hogs and security threats, network monitoring tools help IT teams maintain visibility and control over complex infrastructures.
- SolarWinds Network Performance Monitor (NPM)
- PRTG Network Monitor
- Nagios Core / Nagios XI
- Zabbix
- ManageEngine OpManager
- Datadog Network Monitoring
- WhatsUp Gold
- LibreNMS
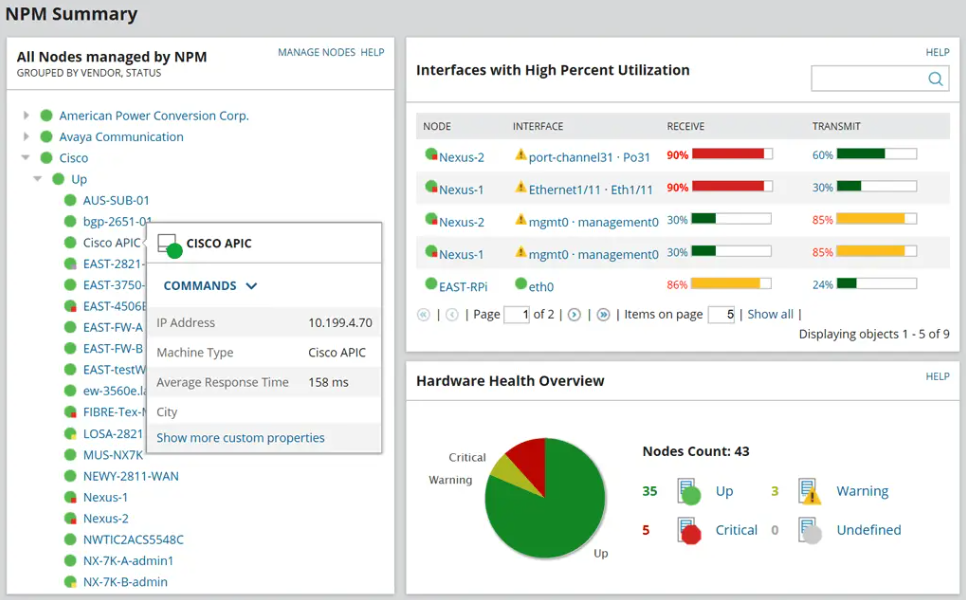
1. SolarWinds Network Performance Monitor (NPM)
SolarWinds is one of the outstanding producers of IT management software. The company’s Network Performance Monitor (NPM) is one of its key products. This system focuses on monitoring the health of the devices connected to a network.
The hardware that SolarWinds NPM keeps an eye on includes network equipment, such as routers and switches; endpoint devices, including terminals, desktop PCs, and mobile devices; and office equipment, such as printers. The constant monitoring process gathers metrics that serve troubleshooting tasks.
The NPM includes a dashboard with comprehensive controls that can help you customize your views of network data and also filter the events that are reported by the system. This is a very flexible system that is suitable for any size of network.
The NPM is a standalone package, and it can work as an integration with the company’s other product to offer an end-to-end unified IT management solution.
2. PRTG Network Monitor
PRTG is a comprehensive network monitoring application for Windows-based systems. It is suitable for networks of all sizes and capable of LAN, WAN, WLAN, and VPN monitoring. You can also monitor physical or virtual web, mail, and file servers, Linux systems, Windows clients, routers, and much more.
It monitors network availability and bandwidth usage, as well as various other network parameters such as quality of service, memory load, and CPU usage, even on remote machines. It also provides system administrators with live readings and periodical usage trends to optimize the efficiency, layout, and setup of leased lines, routers, firewalls, servers, and other network components.
The software monitors a network that uses Simple Network Management Protocol (SNMP), Windows Management Instrumentation (WMI), packet sniffer, Cisco NetFlow, IPFIX, sFlow, jFlow, and many other industry-standard protocols.
It runs on a Windows-based machine in your network for 24 hours a day. PRTG constantly records the network usage parameters and the availability of network systems. The recorded data is stored in an internal database for later analysis.
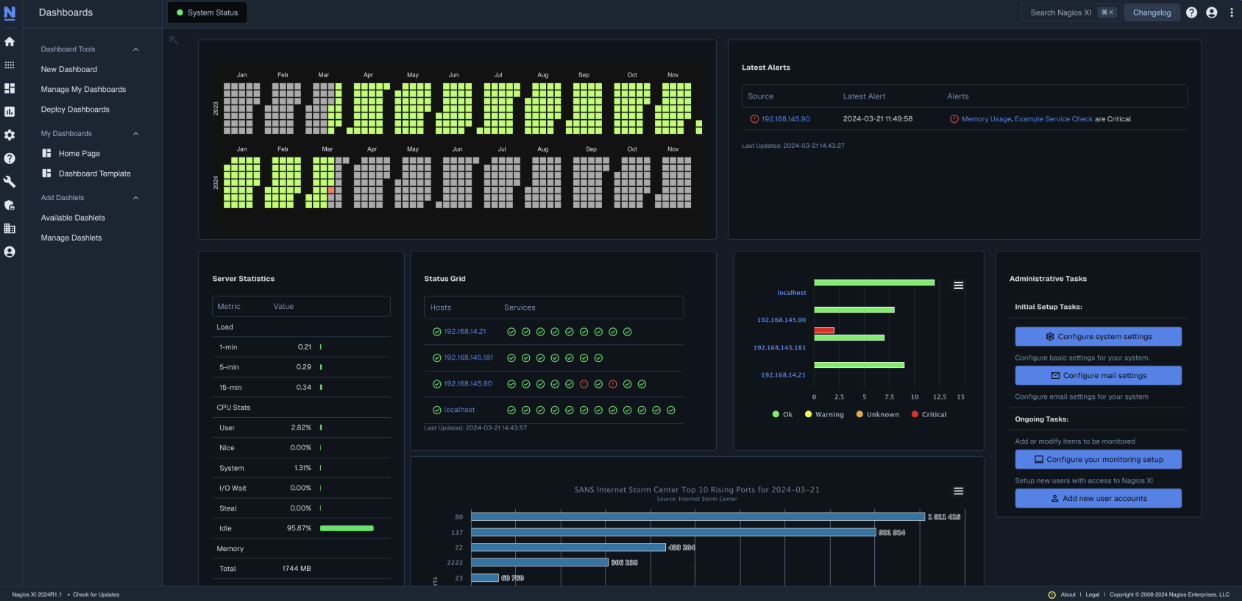
3. Nagios Core / Nagios XI
Nagios is an open-source IT system monitoring tool. It was designed to run on the Linux operating system and can monitor devices running Linux, Windows, and Unix OSes.
It offers two main products: Nagios Core and Nagios XI.
Nagios Core
The service that was originally known as Nagios is now referred to as Nagios Core. Core is freely available as open-source monitoring software for IT systems, networks, and infrastructure. Core contains a wide array of infrastructure monitoring through allowing plugins to extend its monitoring capabilities. It is the base for paid Nagios monitoring systems.
Nagios Core has an optional web interface, which displays network status, notifications, and log files. Core can notify its user when there are server or host issues. Additionally, Core can monitor network services such as SMTP, HTTP, and Ping.
Nagios XI
Nagios XI is an extended interface of Nagios Core, intended as the enterprise-level version of the monitoring tool. XI acts as monitoring software, a configuration manager, and a toolkit.
Nagios XI monitors IT infrastructure components such as applications, OSes, networks, and system metrics. Plugins are supported for these infrastructure components to expand on XI’s monitoring capabilities.
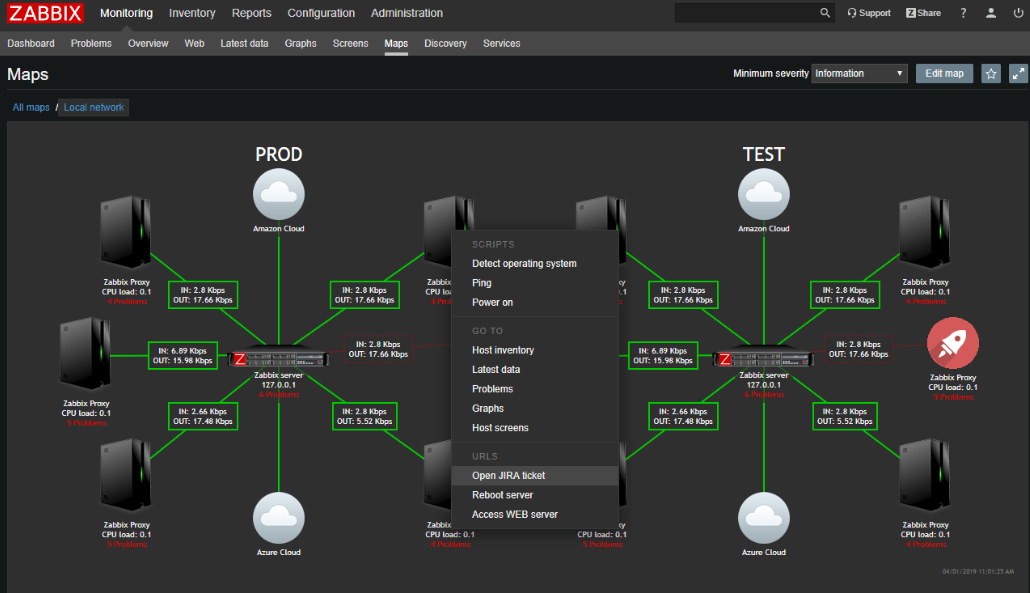
4. Zabbix
Zabbix is a full-scale network and system monitoring tool that combines several functions into a single web-based console. It can be configured to monitor and collect data from a wide range of servers and network devices and provides service and performance monitoring for each site.
We often use Zabbix when we want to monitor the resources of our servers and don’t have time to go through the logs like when we’re operating numerous servers and want to make sure that everything is working properly.
In this situation, Zabbix will do the monitoring and inform us in case of a problem, allowing us to configure multiple communication paths. Zabbix informs us, for example, if a particular “endpoint” is not working or is running out of disk space, or if the CPU is overloaded.
Zabbix automatically sends us all information that might affect the quality of the application’s performance.
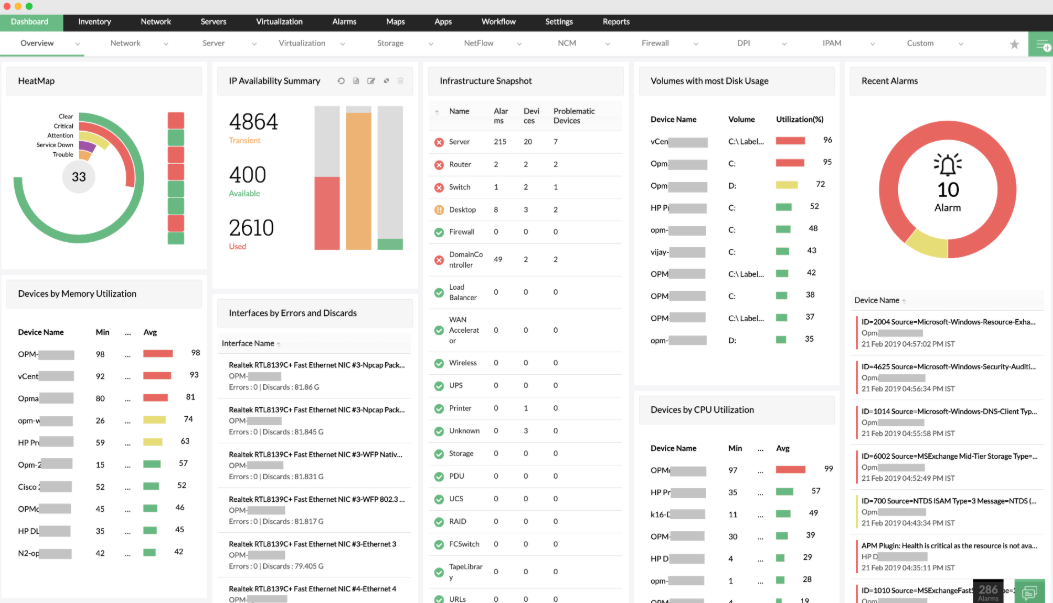
5. ManageEngine OpManager
ManageEngine OpManager is integrated network, system, application, and data center monitoring software that offers advanced fault and performance management functionalities. It is an affordable, easy-to-use, and easy-to-install tool that works right out of the box.
It is primarily an on-premises solution, allowing organizations to host and control it within their own infrastructure. In addition, ManageEngine offers hybrid and cloud-based monitoring options, enabling businesses to monitor cloud-hosted environments alongside their on-premises setups. This flexibility ensures that OpManager can adapt to a wide range of IT environments.
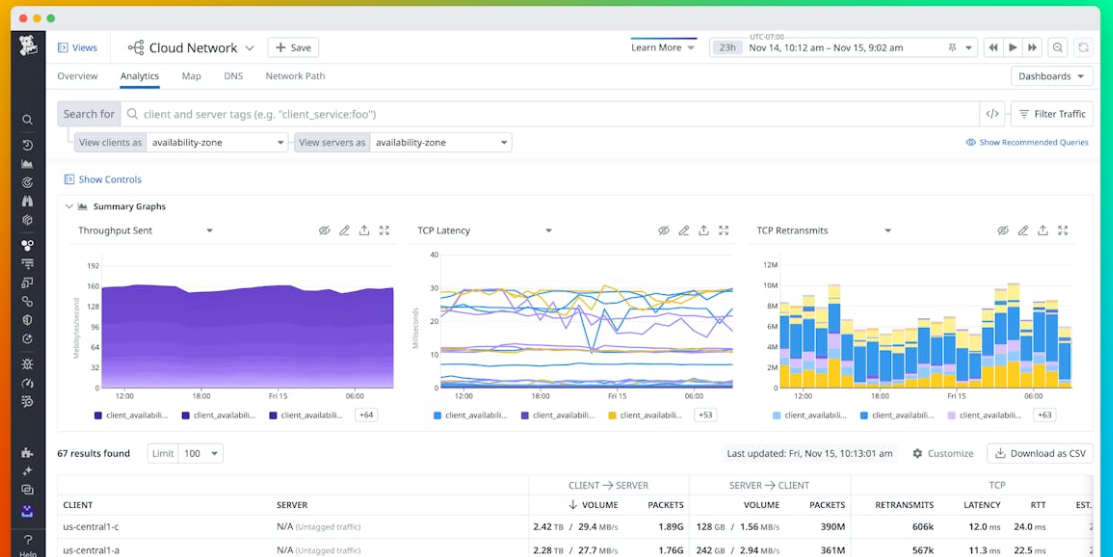
6. Datadog Network Monitoring
Datadog is a monitoring and analytics tool for information technology (IT) and DevOps teams that can be used to determine performance metrics as well as event monitoring for infrastructure and cloud services. The software can monitor services such as servers, databases, and tools.
It is available for deployment on-premises or as software as a service (SaaS). Datadog supports Windows, Linux, and Mac operating systems. Support for cloud service providers includes AWS, Microsoft Azure, Red Hat OpenShift, and Google Cloud Platform.
Datadog uses a Go-based agent, and its backend is made from Apache Cassandra, PostgreSQL, and Kafka. A REST application program interface (API) is used to allow Datadog to integrate with numerous services, tools, and programming languages. Integrations such as Kubernetes, Chef, Puppet, Ansible, Ubuntu, and Bitbucket.
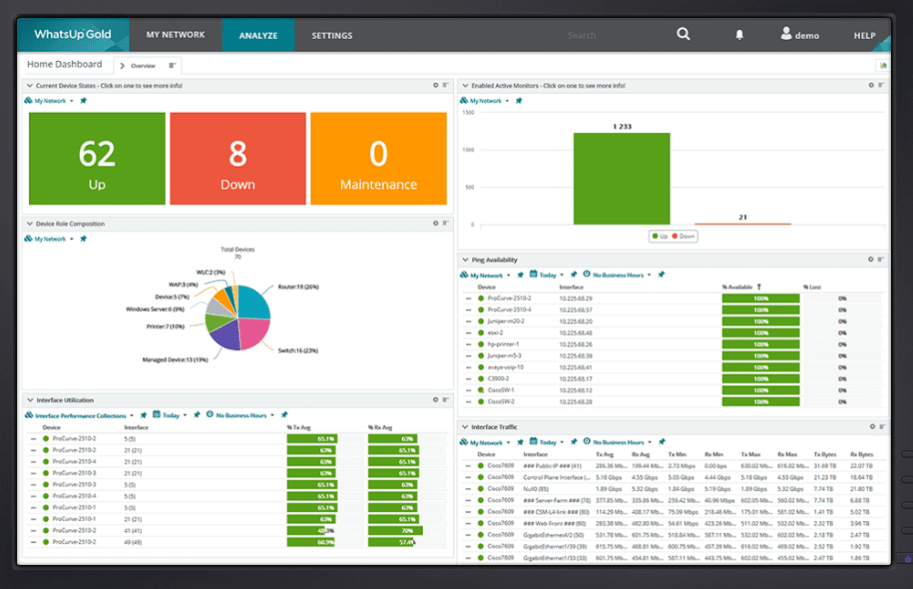
7. WhatsUp Gold
WhatsUp Gold is one of the best network monitoring tools when it comes to load balancing your systems. Its scaling is horizontal and allows various processes to be used to distribute the load. You can perform some automatic actions based on the events that took place.
Like other tools, such as Pandora FMS or Solarwinds, it has a system to auto-discover networks and topologies. In addition, by creating proprietary scripts, more applications or services can be added and integrated into monitoring.
You can connect from mobile devices to access the monitoring dashboard. Alerts can be received through email, SMS, and other different types, and their information is offered in real time.
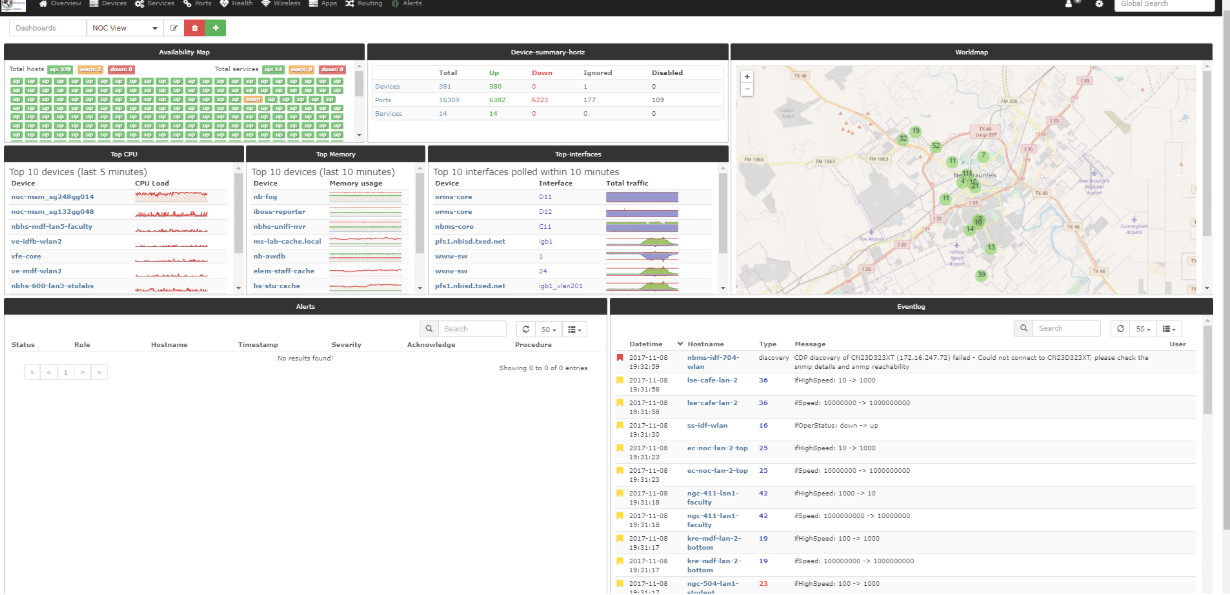
8. LibreNMS
LibreNMS is a free and open-source network monitoring solution that helps IT teams automatically identify and oversee network devices using SNMP. It offers real-time insight into the status and performance of routers, switches, firewalls, servers, and other essential network infrastructure components.
LibreNMS supports a broad range of vendors and includes features such as detailed traffic charts, performance statistics, and alert notifications to quickly spot problems.
With automated device discovery, flexible dashboards, and solid community support, LibreNMS delivers a cost-efficient solution for maintaining network stability and ensuring reliable operations across both small and large IT environments.
Conclusion
Network monitoring tools are no longer optional. They are essential for keeping modern IT environments secure, reliable, and high-performing.
The right tool gives clear visibility into the network, early alerts for problems, and confidence in your infrastructure. By focusing on real business needs instead of extra features, organizations can select a tool that delivers long-term value, stable operations, and improved IT efficiency.


Pingback: Top 7 Server Monitoring Tools for Uptime Guarantee - TopatTop.com