As organizations and their IT infrastructure become more complex the necessity for effective server monitoring grows. Companies are deciding to operate extensive server networks, utilizing both cloud infrastructure and on-premises data centers due to the ever-increasing demand. Today’s users demand as good as 100% uptime for the services they use, meaning optimal and well-established network connections are vital in order to handle large amounts of users and transactions.
For these reasons, especially for organizations relying on cloud-deployed servers investing in a strong server monitoring tool is crucial to ensure performance, availability, and security. However, with so many server monitoring solutions available, choosing the right one for your organization can be challenging.
Below are top 7 server monitoring tools:
- Nagios
- Zabbix
- Prometheus
- Datadog
- SolarWinds Server & Application Monitor
- ManageEngine OpManager
- PRTG Network Monitor
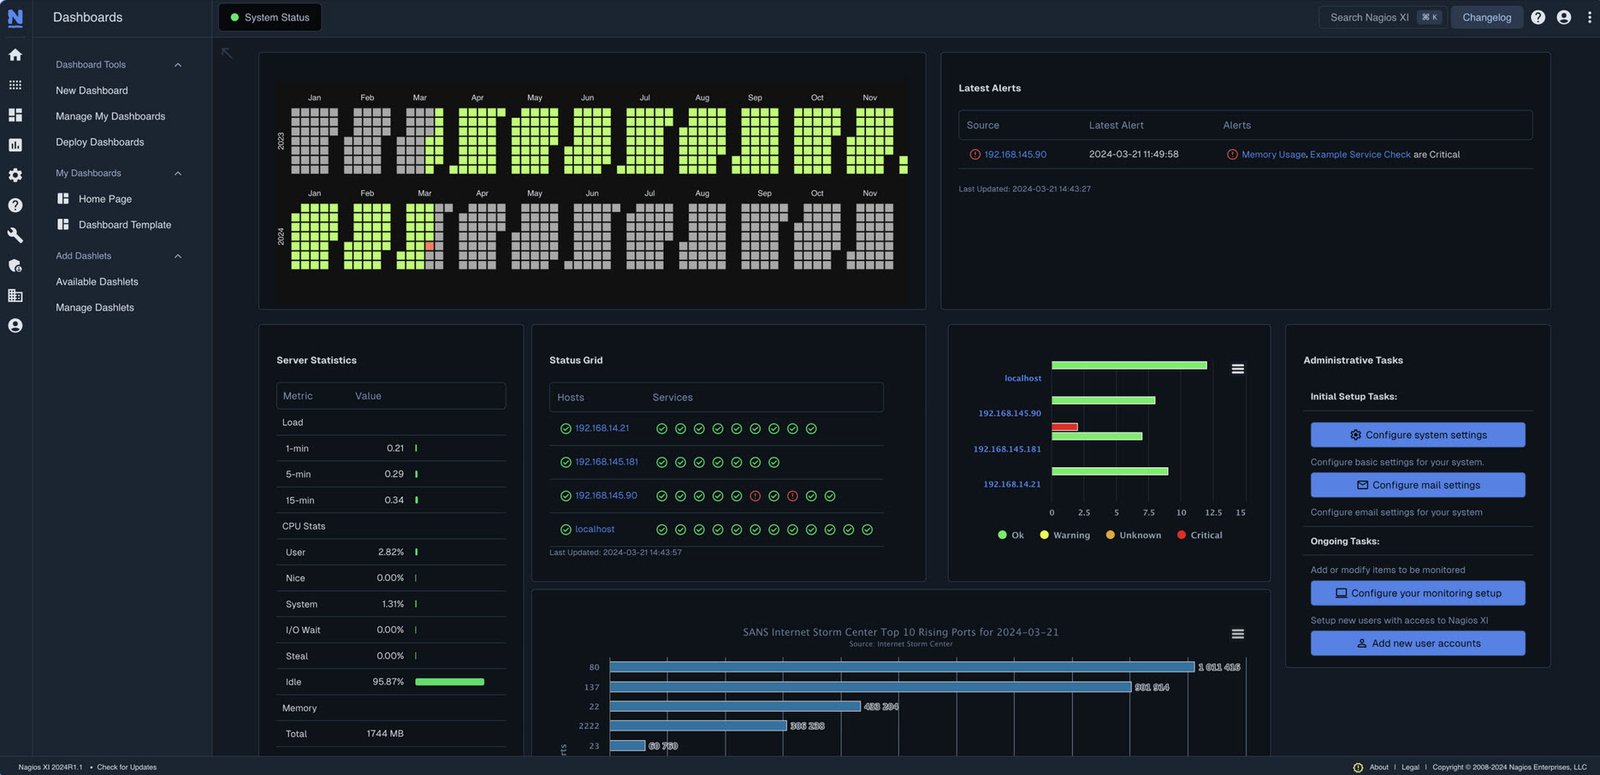
1. Nagios
Nagios is an Open Source IT system monitoring solution. It was designed to run on the Linux operating system and can monitor devices running on Linux, Windows and Unix OSes.
Nagios software runs periodic checks on critical parameters of application, network and server resources. For example, it can monitor memory use, disk use and microprocessor load, as well as the number of currently running processes and log files.
It also can monitor services such as Simple Mail Transfer Protocol (SMTP), POP3, Hypertext Transfer Protocol (HTTP) and other common network protocols.
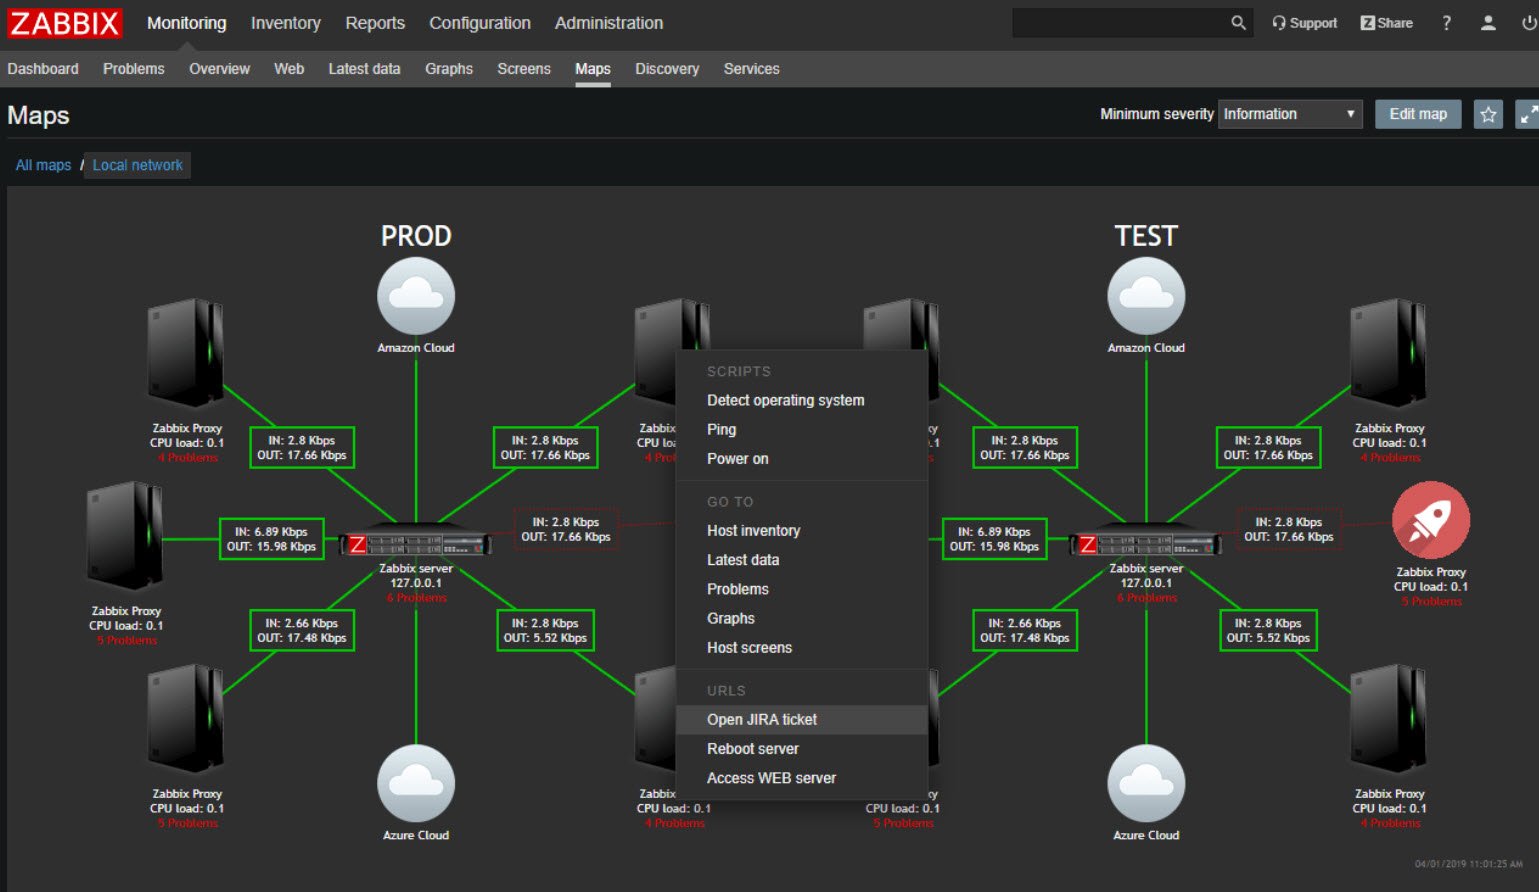
2. Zabbix
Zabbix offers server monitoring software that monitors a range of server performance metrics and incidents covering server performance, server availability, and configuration changes.
Some of these metrics and incidents include network bandwidth usage, power supply in a critical state, and new components added or removed.
With this, you can easily visualize your data with dashboards, network graphs, topology maps, geo maps, and problem timelines.
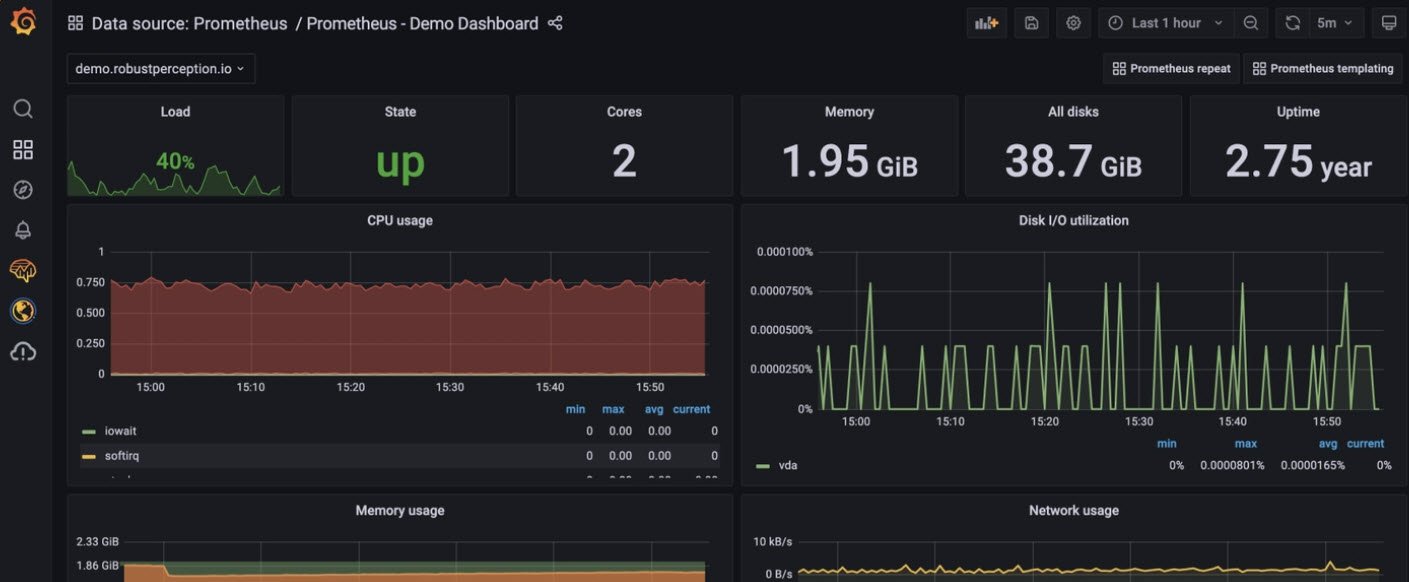
3. Prometheus
Prometheus is an open-source tool for monitoring and collecting application metrics. This system makes it easy for users to see and understand essential metrics that tell them how well an application is doing. It can collect over one million metrics per second and store them until you’re ready to retrieve them.
Prometheus shines with features like multi-dimensional data collection, flexible alerting, and its own query language called PromQL. In terms of integrations, it supports tools such as Grafana, Kubernetes, and various service discovery mechanisms to enhance its monitoring reach.
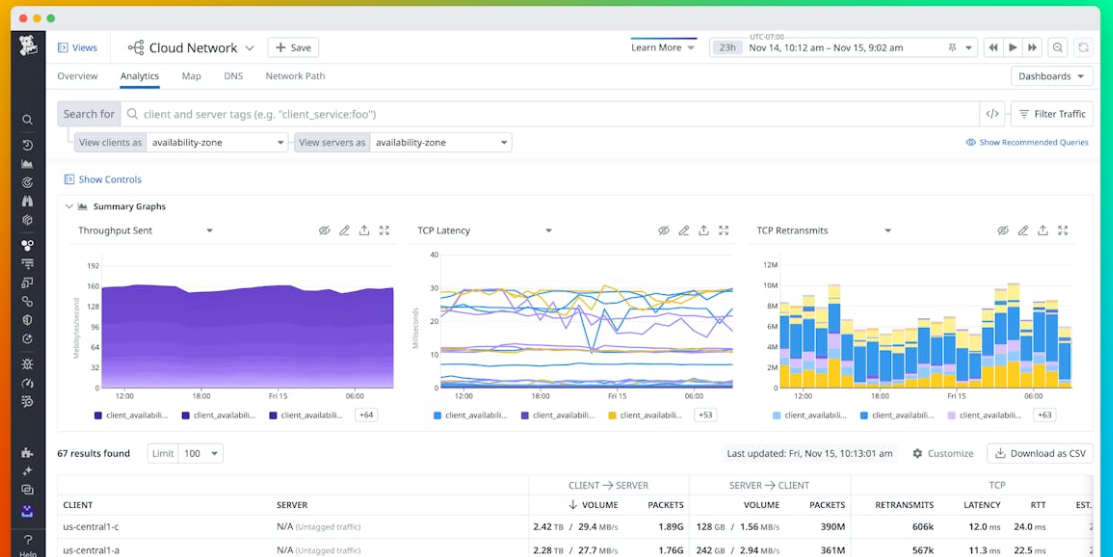
4. Datadog
Datadog is a cloud-based monitoring and analytics platform that helps companies keep their applications and services running smoothly. At its core, it offers real-time monitoring of servers, databases, and numerous other tools and services across the IT infrastructure.
It provides visibility into the performance of applications and enables businesses to detect issues before they affect users. It collects, searches, and analyzes traces across fully distributed architectures, providing insights into IT operations and performance, which is critical for maintaining system health and efficiency.
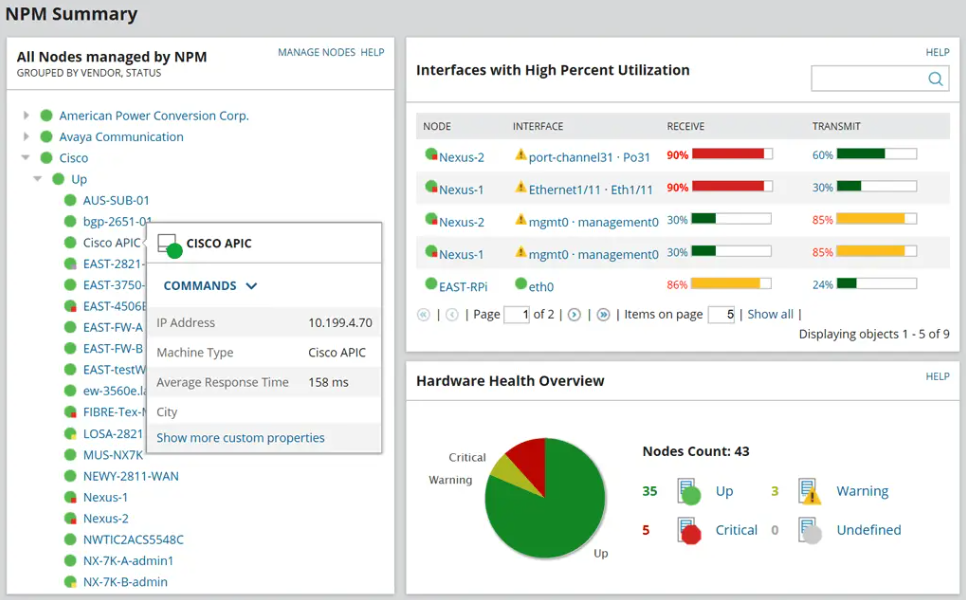
5. SolarWinds Server & Application Monitor
SolarWinds Server & Application Monitor (SAM) enables server and application monitoring in modern IT environments. It is an on-premise installed solution, which is offered standalone or as part of the SolarWinds Hybrid Cloud Observability platform.
This solution comes with over 1,200 out-of-the-box monitoring templates and more than 1,000 community-contributed templates. This helps organizations monitor workloads in a way that fits their specific operational needs.
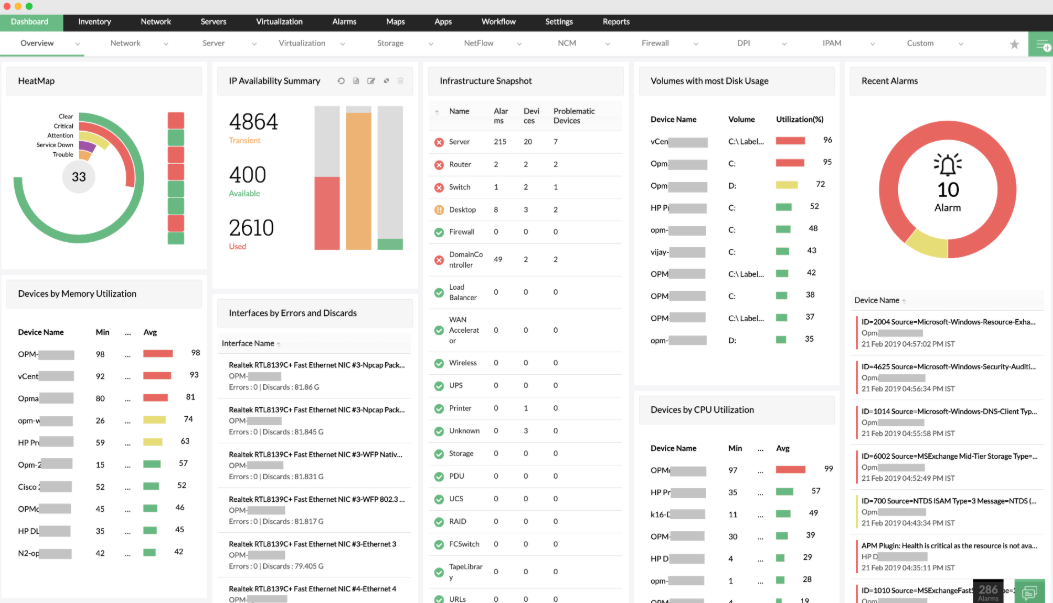
6. ManageEngine OpManager
ManageEngine OpManager is a network monitoring software designed for network administrators. It enables users to monitor network devices such as routers, switches, firewalls, load balancers, wireless LAN controllers, servers, VMs, printers, and storage devices, set multiple thresholds and get alerts for violation, assess the default dashboards, track key metrics such as latency, jitter, RTT, and packet loss to eliminate network issues, as well as view hop-by-hop performance to find what’s causing latency.
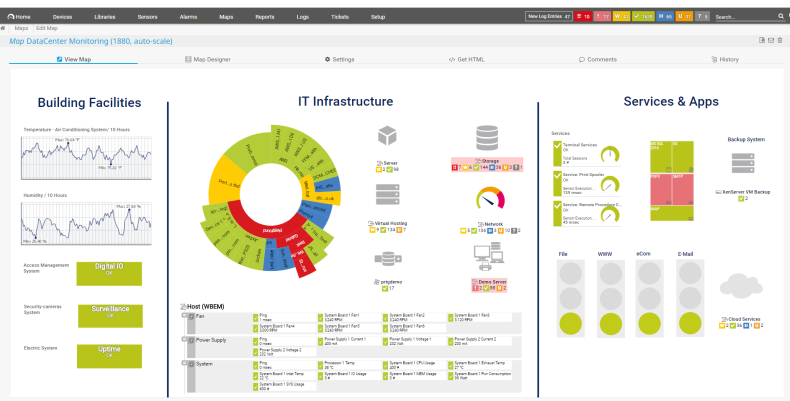
7. PRTG Network Monitor
PRTG is a versatile server monitoring tool designed for small to mid-sized networks. It helps IT teams monitor their entire infrastructure, including mail, web, database, file, virtual, and cloud servers.
It offers a simple server monitoring tool that tracks the usual metrics like uptime, health, disk space, and performance. PRTG tracks your web servers and websites to ensure that your organization’s web presence is always up & running and monitors every key parameter of your servers. It also monitors server availability to ensure systems are running properly.
Conclusion
Server monitoring is a diverse and extensive field of knowledge with varying mechanisms, requirements, and expectations. Choosing the right server monitoring tool that aligns with your unique environment gives you the best chance at optimizing server performance.
In today’s IT landscape, applications, services, and data are distributed across complex infrastructures. Optimal server performance is directly proportional to a positive user experience and business success.


Pingback: Top 9 Patch Management Tools for Secure Systems – TopatTop.com